Demand remains uncertain for carriers as we move through the peak season in trucking. In the latest Trucking Ton-Mile Index (TTMI) release, Professor Jason Miller of Michigan State University said, “Demand continues to move along the bottom of a trough. While September saw a 0.6% seasonally adjusted increase from August, this arises because not-seasonally adjusted ton-miles fell just 1.6% in September from August. Year-over-year (y/y), the ton-mile index was down 1.1%; the not-seasonally adjusted index was down 1.8%. For reference, ton-miles were up 1.6% from September 2019.”
According to Prof. Miller, “I continue to struggle to foresee a scenario where volume increases anytime soon, and as I’ve discussed previously, I see few signs that a large amount of capacity is likely to leave the market over the coming months. At least for the dry van sector, this suggests we are far from a bull market pricing cycle.”
Get the clearest, most accurate view of the truckload marketplace with data from DAT iQ.
Tune into DAT iQ Live, live on YouTube or LinkedIn, 10am ET every Tuesday.
Market Watch
All rates cited below exclude fuel surcharges unless otherwise noted.
Christmas tree shipping season is in full swing in the Pacific Northwest (PNW) as growers rush to get trees into position for peak sales next Monday. Outbound PNW dry van rates increased by $0.07/mile to $1.59/mile last week, identical to 2019 rates. Oregon reported the best gains – linehaul rates jumped by $0.11/mile to $1.55/mile and are on track to peak around last year’s season-high of $1.70/mile. On the Portland to Stockton lane, loads moved increased by 10% week-over-week (w/w), and at $1.32/mile, linehaul rates were up $0.15/mile last week.
In DAT’s Top 5 states for spot market volume, outbound dry van rates in California dropped for the third week to $1.95/mile, while in Texas, spot rates at $1.39/mile are just $0.04/mile higher than 2019. New Jersey reported a $0.02/mile decrease to $1.39/mile. Illinois and Georgia were the only Top 5 states to post gains last week – linehaul rates were up around $0.03/mile w/w to $2.05/mile and $1.50/mile, respectively.
Load-to-Truck Ratio (LTR)
Dry van spot market load post (LP) volume is 32% lower than last year and the pre-pandemic average for Week 46 following last week’s 7% gain. Carrier equipment posts decreased by 10% w/w, resulting in last week’s dry van load-to-truck ratio (LTR) increasing to 1.96, still the lowest LTR in the last seven years.

Linehaul spot rates
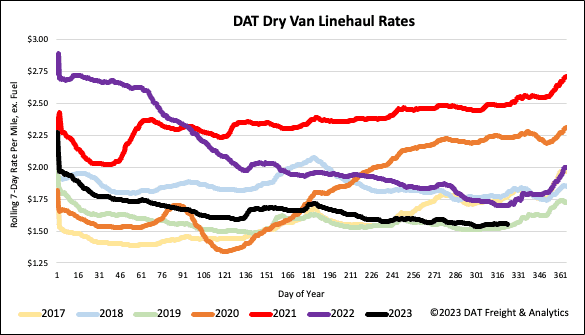
Dry van linehaul rates moved minimally last week, remaining flat for over two months. Compared to last year, line haul rates are $0.15/mile lower and remain only $0.02/mile higher than in 2019. Compared to DAT’s Top 50 lanes based on the volume of loads moved, which averaged $1.86/mile last week, the national average is around $0.29/mile lower.

Weekly reports
The post Dry van market update: Truckload demand continues to move along a trough appeared first on DAT Freight & Analytics – Blog.


